Performance Co-Pilot allow sysadmins to collect and measure data from various systems, it comes in RPM packages for Red Hat 6 to 7
website http://pcp.io/
installing Performance CO-Pilot
yum -y install pcp
pcp packages comes with different services pmcd,pmlogger
pmcd : performance metrics collector daemon
[root@localhost ~]# systemctl enable pmcd ; systemctl start pmcd ; systemctl status pmcd
pmcd.service - Performance Metrics Collector Daemon
   Loaded: loaded (/usr/lib/systemd/system/pmcd.service; enabled)
   Active: active (exited) since Sat 2016-07-23 07:17:24 EDT; 1min 1s ago
     Docs: man:pmcd(8)
 Main PID: 4717 (code=exited, status=0/SUCCESS)
   CGroup: /system.slice/pmcd.service
           ├─4862 /usr/libexec/pcp/bin/pmcd
           ├─4865 /var/lib/pcp/pmdas/root/pmdaroot
           ├─4866 /var/lib/pcp/pmdas/proc/pmdaproc -d 3
           ├─4867 /var/lib/pcp/pmdas/xfs/pmdaxfs -d 11
           └─4868 /var/lib/pcp/pmdas/linux/pmdalinux

Jul 23 07:17:24 localhost.localdomain systemd[1]: Starting Performance Metrics Collector Daemon...
Jul 23 07:17:24 localhost.localdomain pmcd[4717]: Rebuilding PMNS ...
Jul 23 07:17:24 localhost.localdomain pmcd[4717]: Starting pmcd ...
Jul 23 07:17:24 localhost.localdomain systemd[1]: Started Performance Metrics Collector Daemon.
Jul 23 07:18:26 localhost.localdomain systemd[1]: Started Performance Metrics Collector Daemon.
[root@localhost ~]#
pcp packages come with many commands to gather information about the machine like pmatop, pmstat, pminfo, pmval
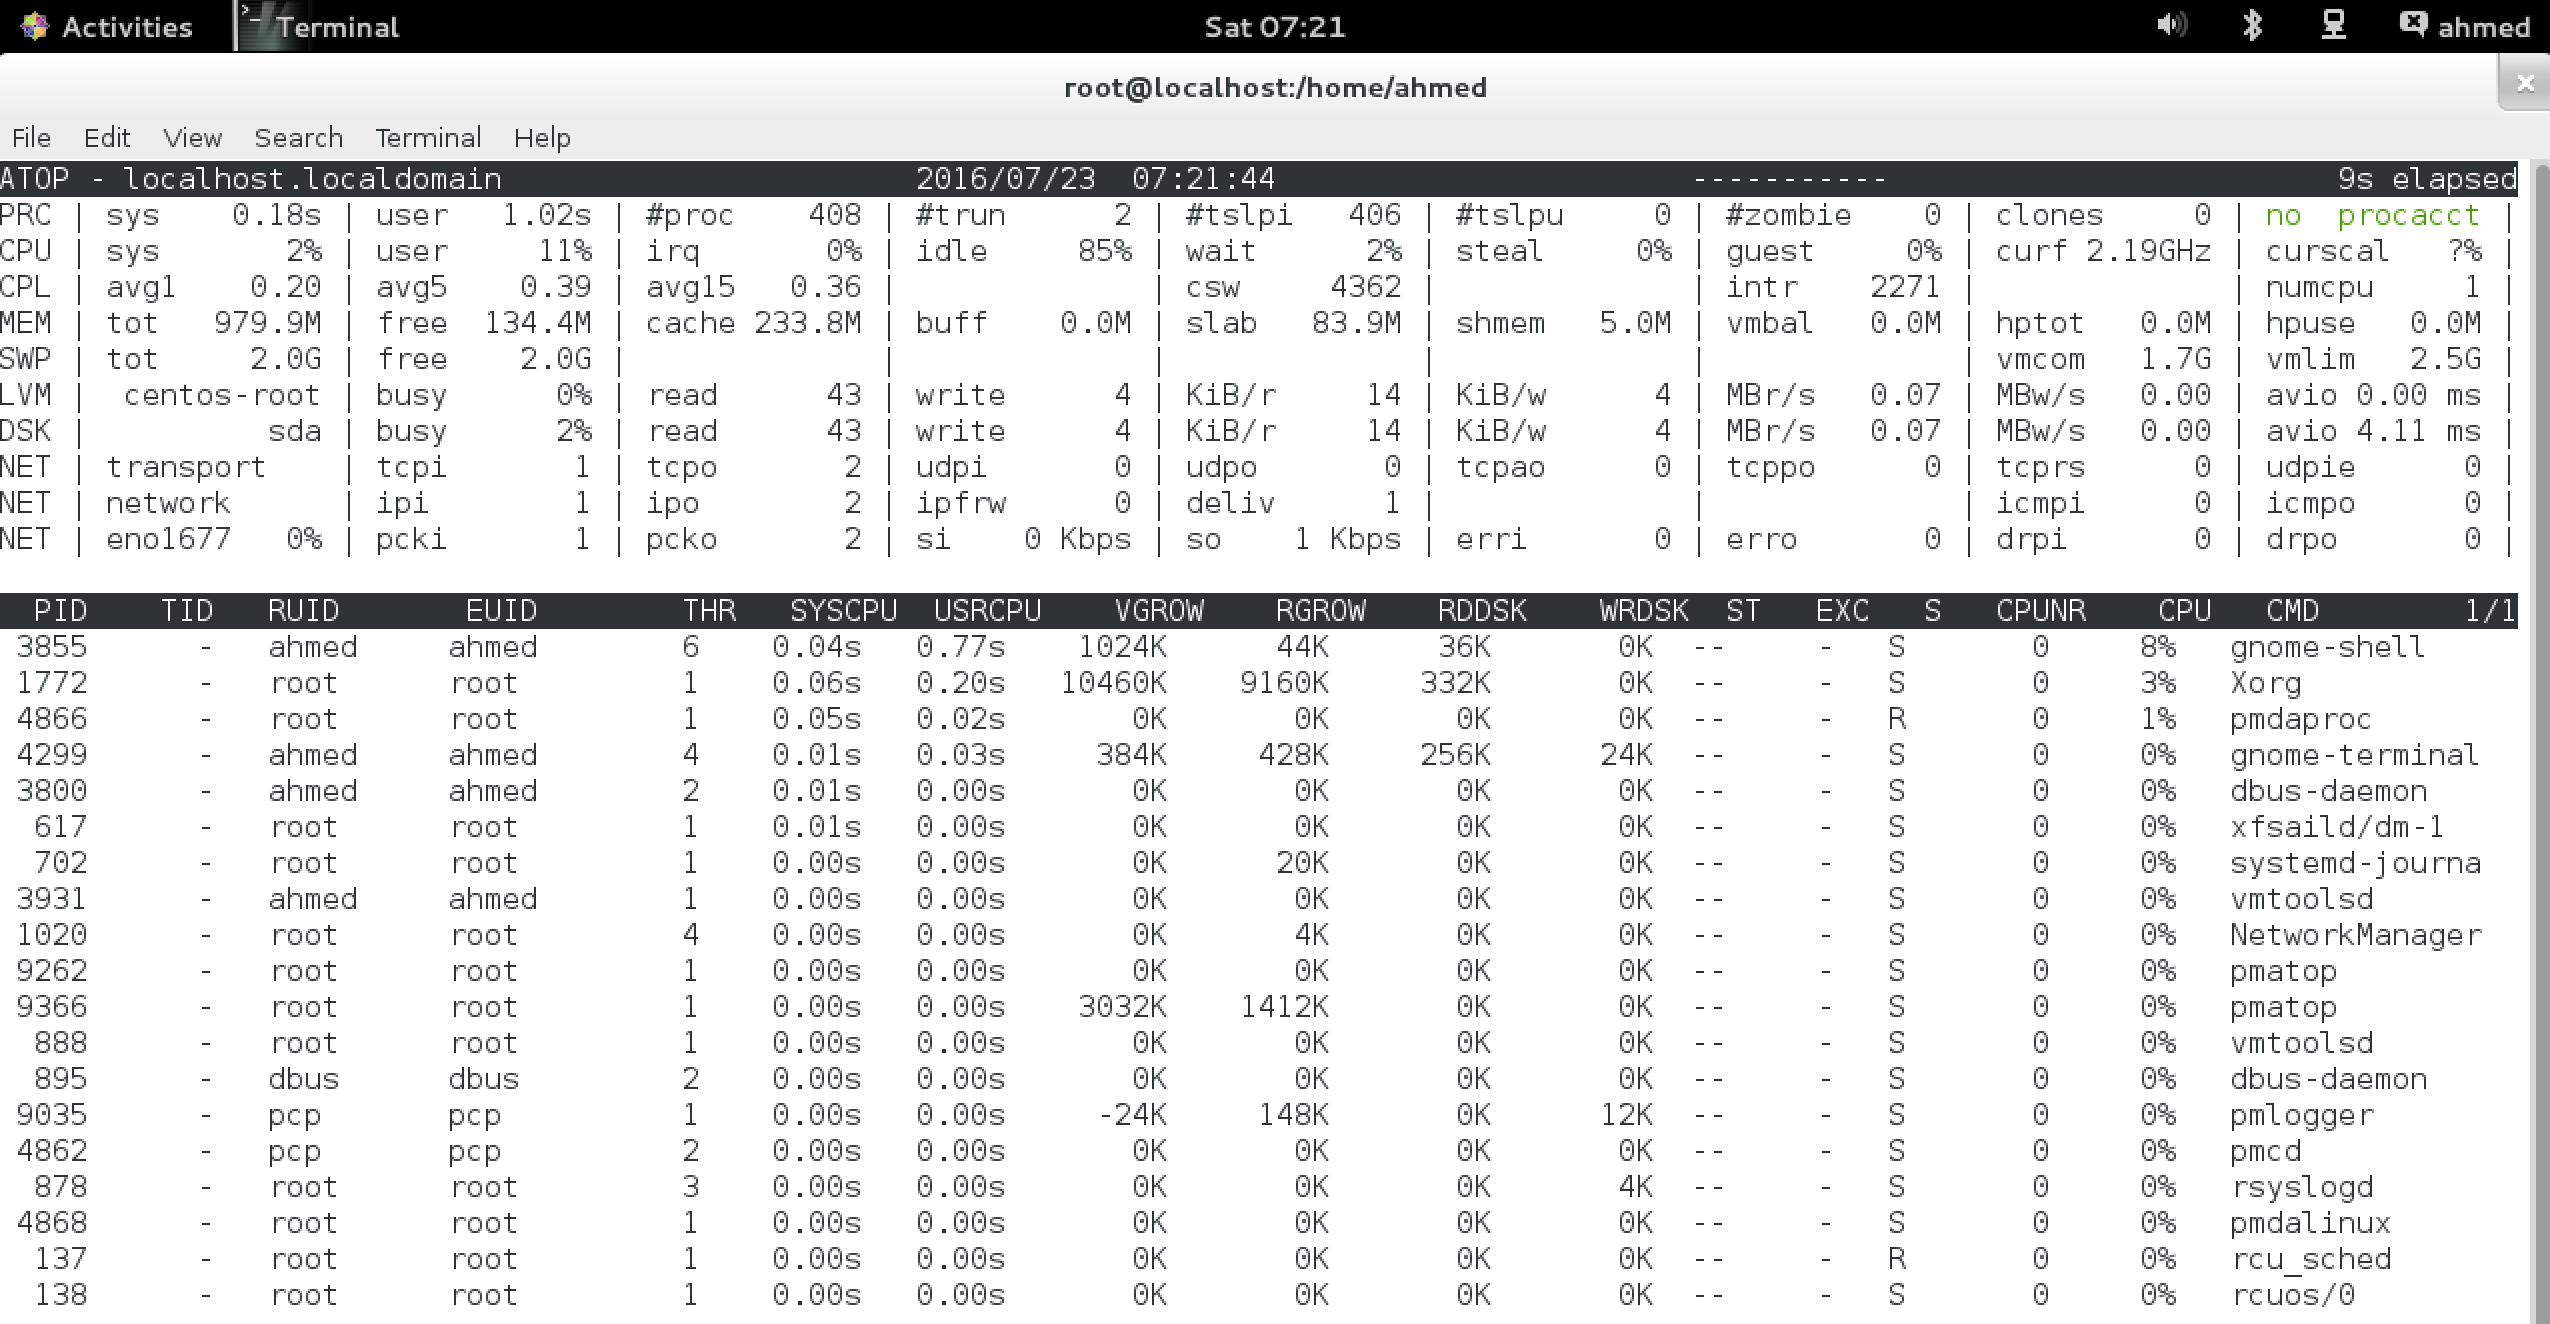
pmatop one of my favourite tool as it gives you a big picture
it shows information about disk , memory, cpu , network , process , swap , lvm
pmstat it show loadavg, memory , swap , io , system , cpu come with -s ( sample counter [how many times it should collect this data ] ) and -t for the time interval
[root@localhost ~]# pmstat
@ Sat Jul 23 07:27:54 2016
 loadavg                      memory      swap        io    system         cpu
   1 min   swpd   free   buff  cache   pi   po   bi   bo   in   cs  us  sy  id
    0.08   2720 119224      0 257332    0    0    1    0  139  129   1   1  98
    0.07   2716 118768      0 257404    0    0   32    6  590  912   6   8  81
    0.07   2716 118752      0 257404    0    0    0    1  138  112   1   1  99
    0.06   2716 118752      0 257404    0    0    0    6  107  102   0   0 100
    0.06   2716 118720      0 257404    0    0    0   80  131  113   1   1  99
    0.05   2716 118516      0 257404    0    0    0    0   98   98   0   0 100
    0.05   2716 118564      0 257404    0    0    0    0  123  111   1   1  99
    0.12   2716 118564      0 257404    0    0    0    1   94   96   0   0 100
    0.11   2716 118548      0 257412    0    0    0    4  118  109   0   1  99
    0.10   2716 118548      0 257412    0    0    0    0   98   97   0   0 100
    0.10   2716 118500      0 257412    0    0    0  115  130  114   0   1  99
    0.09   2716 118500      0 257412    0    0    0    0  102  100   0   0 100
    0.08   2716 118696      0 257412    0    0    0    0  132  122   1   1  99
^C
pminfo command to list all available metrics
[root@localhost ~]# pminfo |grep kernel
kernel.all.load
kernel.all.intr
kernel.all.pswitch
kernel.all.sysfork
kernel.all.hz
kernel.all.uptime
kernel.all.idletime
kernel.all.nusers
kernel.all.lastpid
kernel.all.runnable
kernel.all.nprocs
kernel.all.cpu.user
kernel.all.cpu.nice
kernel.all.cpu.sys
kernel.all.cpu.idle
kernel.all.cpu.intr
kernel.all.cpu.steal
kernel.all.cpu.guest
kernel.all.cpu.vuser
--more--
lets use metrics called network.interface.in.bytes to see how many bytes we receive in our interface
[root@localhost ~]# pmval -s 5 network.interface.in.bytes

metric:    network.interface.in.bytes
host:      localhost.localdomain
semantics: cumulative counter (converting to rate)
units:     byte (converting to byte / sec)
samples:   5
interval:  1.00 sec

       eno16777736                    lo
             131.9                   0.0
              65.97                  0.0
              65.96                  0.0
              65.96                  0.0
              65.96                  0.0
let’s start pmlogger
[root@localhost ~]# systemctl enable pmlogger ; systemctl start pmlogger; systemctl status pmlogger
pmlogger.service - Performance Metrics Archive Logger
   Loaded: loaded (/usr/lib/systemd/system/pmlogger.service; enabled)
   Active: active (exited) since Sat 2016-07-23 07:17:25 EDT; 19min ago
     Docs: man:pmlogger(1)
 Main PID: 4902 (code=exited, status=0/SUCCESS)
   CGroup: /system.slice/pmlogger.service
           └─9035 /usr/libexec/pcp/bin/pmlogger -P -r -T24h10m -c config.default -m pmlogger_check 20160723.07.17

Jul 23 07:17:24 localhost.localdomain systemd[1]: Starting Performance Metrics Archive Logger...
Jul 23 07:17:25 localhost.localdomain pmlogger[4902]: Starting pmlogger ...
Jul 23 07:17:25 localhost.localdomain systemd[1]: Started Performance Metrics Archive Logger.
Jul 23 07:37:15 localhost.localdomain systemd[1]: Started Performance Metrics Archive Logger.
[root@localhost ~]#
the pmlogger service will save the log archievs into /var/log/pcp/pmlogger/[hostname]/date-day
we can use pmval with parameter -a to tell it to use this archive and set the matrix
[root@localhost ~]# pmval -a  /var/log/pcp/pmlogger/localhost.localdomain/20150918.17.37.0 kernel.all.load

17:56:18.812    7.000E-02     8.000E-02        0.2100
17:56:19.812    7.000E-02     8.000E-02        0.2100
17:56:20.812    7.000E-02     8.000E-02        0.2100
17:56:21.812    7.000E-02     8.000E-02        0.2100
17:56:22.812    7.000E-02     8.000E-02        0.2100
17:56:23.812    7.000E-02     8.000E-02        0.2100
17:56:24.812    7.000E-02     8.000E-02        0.2100
17:56:25.812    7.000E-02     8.000E-02        0.2100
17:56:26.812    7.000E-02     8.000E-02        0.2100
17:56:27.812    7.000E-02     8.000E-02        0.2100
17:56:28.812    7.000E-02     8.000E-02        0.2100
17:56:29.812    7.000E-02     8.000E-02        0.2100
17:56:30.812    7.000E-02     8.000E-02        0.2100
we can assign specified start and end time for pmval
-S start time, -T end time
with ISO-formatted date example -S ‘@ Wed Feb 25 05:01:00 2016’ -T ‘@ Wed Feb 25 06:01:00 2016’
this will query 2 hours from 5am Feb 25 2016 TO 7am Feb 25 2016 with the metrics you like
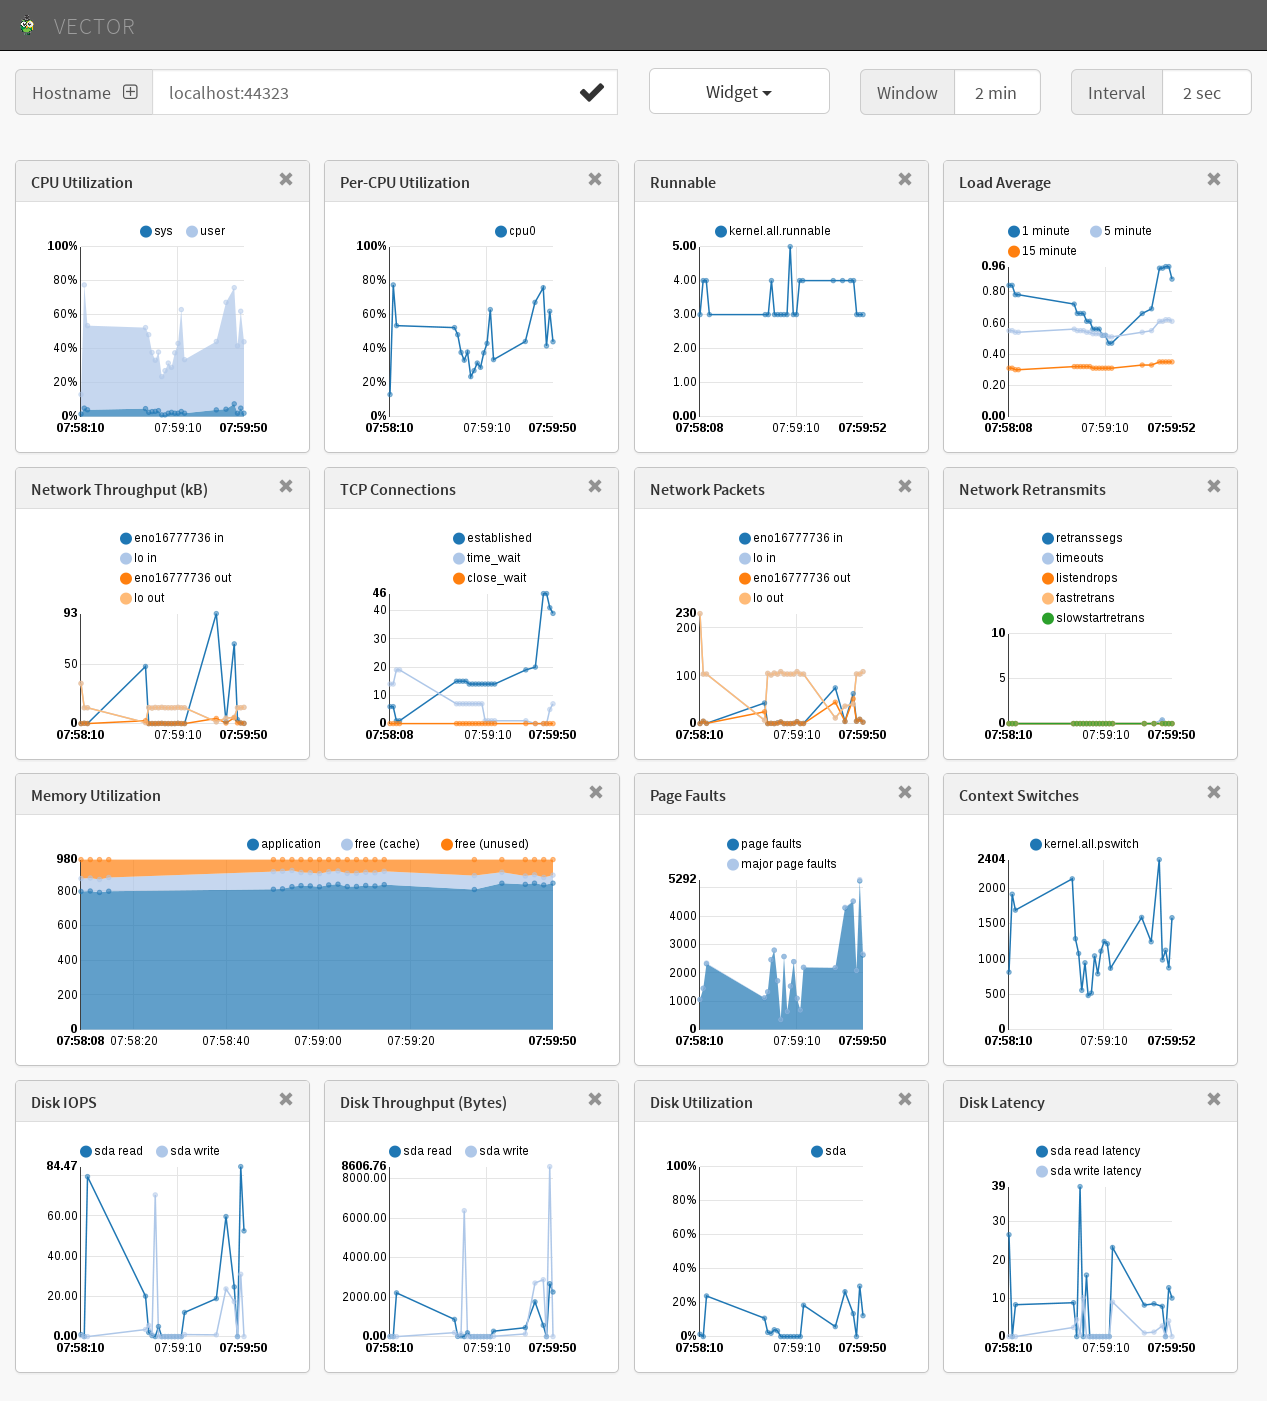
not the fun part pcp offer a web real-time monitor in different flavours and styles one of my best is called vector.
first we need to install and run the pcp web service
[root@localhost ~]# yum install pcp-webjs
[root@localhost ~]# systemctl start pmwebd
[root@localhost ~]# systemctl status pmwebd
pmwebd.service - Performance Metrics Web Daemon
   Loaded: loaded (/usr/lib/systemd/system/pmwebd.service; disabled)
   Active: active (exited) since Sat 2016-07-23 07:53:20 EDT; 5s ago
     Docs: man:pmwebd(8)
  Process: 11173 ExecStart=/usr/share/pcp/lib/pmwebd start (code=exited, status=0/SUCCESS)
 Main PID: 11173 (code=exited, status=0/SUCCESS)

Jul 23 07:53:19 localhost.localdomain systemd[1]: Starting Performance Metrics Web Daemon...
Jul 23 07:53:20 localhost.localdomain pmwebd[11173]: Starting pmwebd ...
Jul 23 07:53:20 localhost.localdomain systemd[1]: Started Performance Metrics Web Daemon.
check which port this service use
[root@localhost ~]# ss -anultp|grep pmweb
tcp    LISTEN     0      32                     *:44323                 *:*      users:(("pmwebd",11199,4))
tcp    LISTEN     0      32                    :::44323                :::*      users:(("pmwebd",11199,5))
[root@localhost ~]#
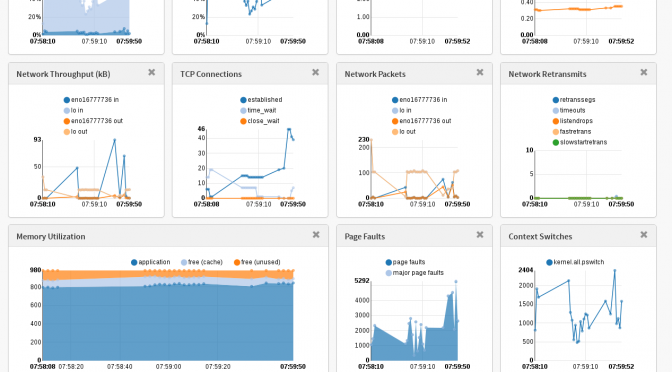
access to localhost:44323/vector
it shows nice metrics of disk IOPS, Throughputs, Network Packets and more
happy debugging folks
Leave a Comment